


As we enter the height of fantasy draft season, I want to help IDP managers form the best possible strategy to dominate their fantasy football leagues and come away with a true league-winning result.
While the rest of your leaguemates are chasing points, the true advantage lies with drafting the IDPs that your leaguemates can’t replace. To do this, we have to understand the positions and tiers where we can gain the most points and avoid the ranges where we lose the most value by drafting at the wrong time.
Building off an excellent episode of The IDP After Show from Jake Kohlhagen and Scott Soltis covering How to Value IDPs, I’ve utilized the top IDP scorers in Big-3 Scoring from 2023 through 2025 at all five IDP positions to develop a full guide on how to approach your 2026 fantasy football drafts.
This three-part series will also cover Avoiding Common Mistakes and League-Winning IDP Targets in 2026. The foundation of this will build off identifying which position(s) and draft ranges the best players come from, which is the focus of Part 1: Leveraging Positional Scarcity.
Past fantasy points will only get you so far
IDP drafters tend to look at previous year’s scoring and trust those numbers to more or less repeat the following year, which is why ADP is so heavily correlated with the previous season’s scoring leaders, though the data points to that not being a reliable guide. This is highlighted in the chart below.
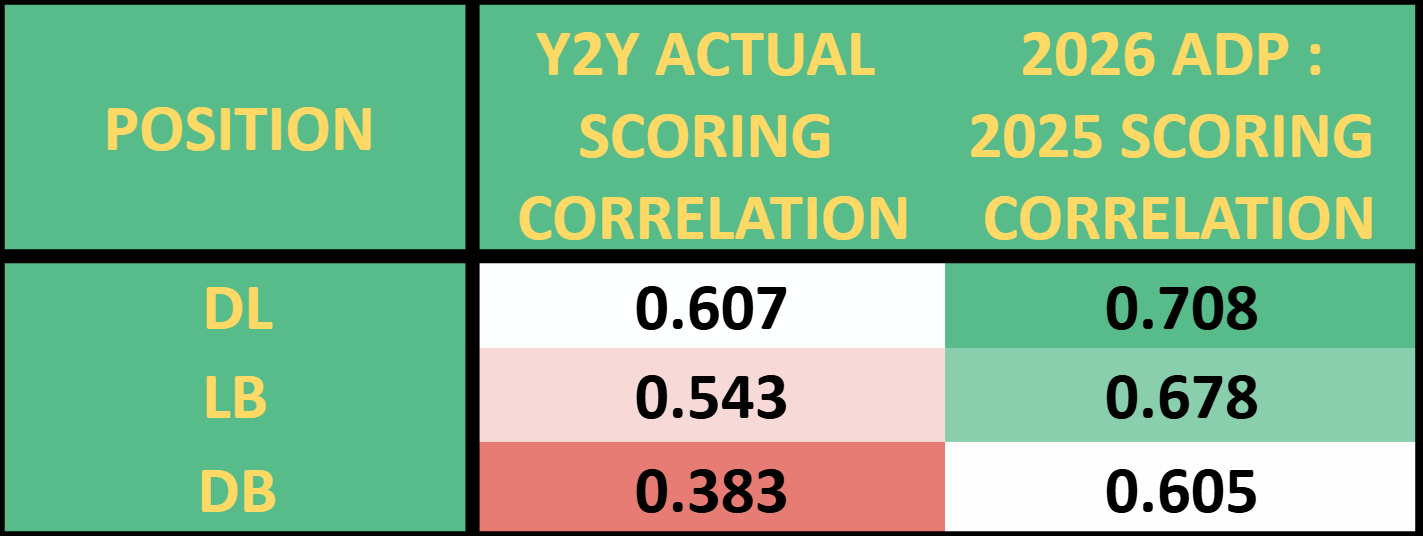
So much can change from one season to the next when it comes to fantasy, and arguably even more so on the defensive side of the ball compared to offense. This comes from defensive players mostly reacting to what the offense is doing and defensive success being tied to what the offense can give them.
Offensive fantasy options typically have more control over their fantasy production, which is what makes the correlation for top scorers at those positions stronger. The real exception for IDP comes from defensive linemen, who rely much more on talent and ability to win against blockers, which is why underlying metrics are significantly more useful at the position, as they help identify the best players. The rest of the IDP positions rely more on factors out of their control, essentially stemming from playing time and deployment.
Knowing that last year’s production isn’t as stable as we typically trust it to be will help build the framework for your draft strategy.
Know your scoring
The next part in understanding the leverage curve for IDP comes from analyzing how the positions score in general. Every league scoring format tends to differ, but for consistency, we’ll lean into the average top scorers (1-48) from the past three seasons using Big-3 Scoring. Different scoring settings will obviously shift results, specifically more tackle-heavy formats where linebackers matter above all else, but we won’t focus on those leagues since they require less strategy as only one position truly matters.
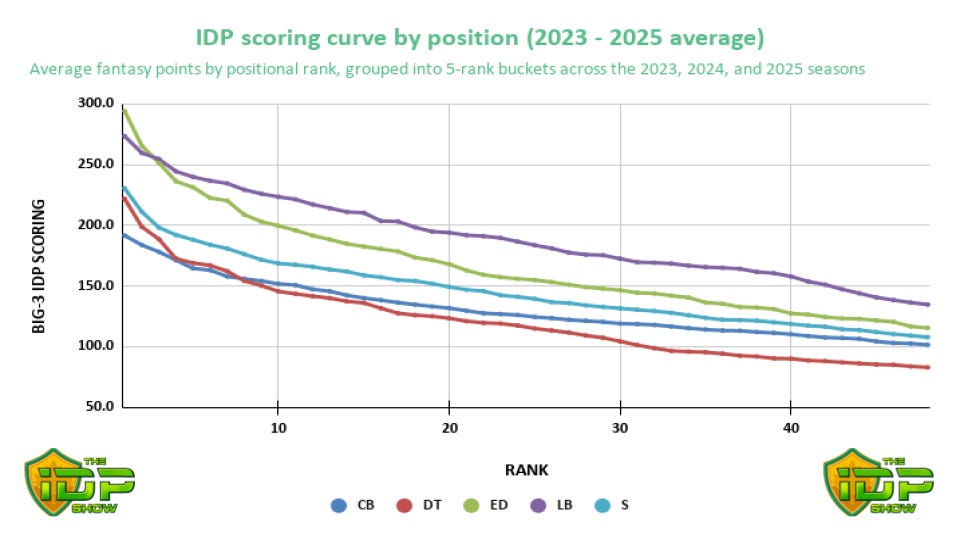
As highlighted in the chart above, you’ll notice that the linebacker position steadily outscores the majority of the top-48 across the board and tends to be the most reliable position for production in IDP. This could lead you to mistakenly think that drafting linebackers early and often in your IDP drafts is the move to make, but the opposite is actually true.
As stated at the top of this article, winning your fantasy leagues is not just about accumulating points; it’s about creating a significant advantage at each position over the rest of your leaguemates and finding the players they can’t replace. The linebacker position having the flattest curve means that usable fantasy production extends much later into the position, rewarding those who are patient when it comes to drafting LBs.
The EDGE and DT positions’ cliff happens much sooner and much more drastically than any of the other positions. EDGE players in particular dominate the overall top scorers across all IDP positions, meaning these are the players that hold true league-winning upside, as long as we’re able to identify the correct options. Based on the previous chart covering the correlation between ADP and previous years’ scorers, we know that previous defensive line scoring leaders and those being drafted highly are our best bets. I’ll be covering who these exact players are in more detail in part three of this draft strategy series.
The defensive tackle position also sees the most dramatic drop in production from the top scorers at the position, and because of the smaller pool of players to choose from, replacing that position becomes extremely difficult as they also own the lowest overall scoring curve. For DT-required formats, this information is crucial when it comes to drafting. It means you shouldn't wait to grab an elite DT if you want that true advantage over the rest of your leaguemates.
Safeties and cornerbacks remain remarkably consistent through the middle and latter stages of the top-48, and while there’s a cliff from the top performers, it’s also one that we don’t have to be concerned about as much. With a high rate of variance in year-to-year scoring correlation at the position and the deep pool of comparable scorers, this is our easiest position to fade in drafts.
Value over replacement players (VORP)
Building off the previous scoring leaders data, VORP allows us to better identify the exact cliff at each position and know exactly where we can make up the most value in our drafts.
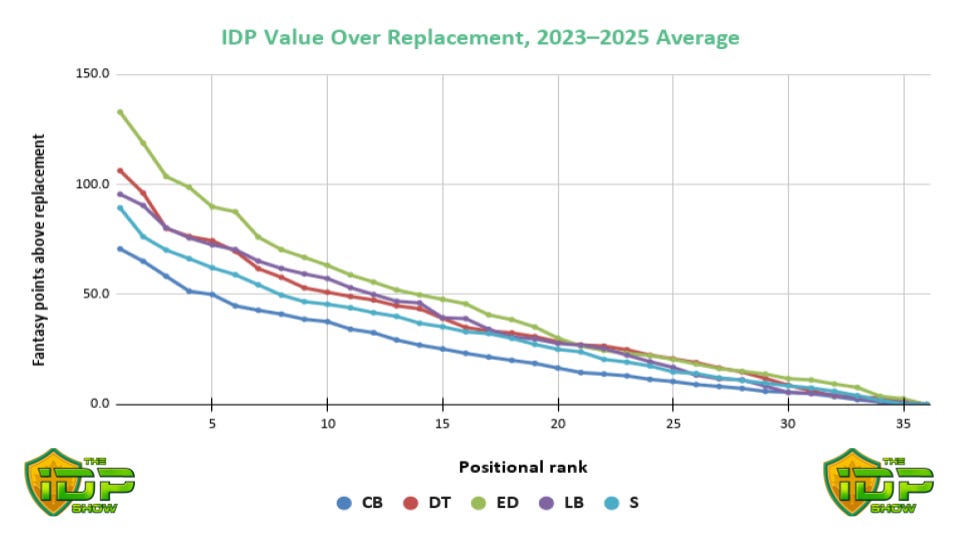
While this chart might look similar to the previous one, I assure you it’s much different, though it conveys the same points. VORP data takes the difference in scoring from the top players at each position (1-36) versus the last real starting option at each position (IDP36).
The first thing that pops out with this data is that the positional advantage gap between EDGE1 and the depth/replacement player (ED36) is massive. By far the biggest gap across all positions, backing up the point from earlier that the first true advantage you should be looking to take over your leaguemates is drafting an elite EDGE (or two) because the other positions can wait; the EDGE position cannot.
Paying for elite production at the EDGE position will keep IDP managers ahead of their leaguemates and not chasing points all season.
There is a seismic difference of 133 fantasy points in value between drafting the ED1 and the ED36. The next closest gap comes at defensive tackle, with a gap of 106.3 points. At linebacker, which, according to ADP, is the closest competition to the EDGE position for those early IDPs off the board, that gap is 95.6 points and stays steadily behind the EDGE position for the majority of the top performers.
Paying for elite production at the EDGE position will keep IDP managers ahead of their leaguemates and not chasing points all season. Knowing that the cliff is steep, don’t wait for ED18 in hopes that he’ll become a top-five player just because you wanted to grab the more “reliable” producers at linebacker. The key is not to get caught up in the safety or tackle numbers at linebacker because the difference between LB12 and LB36 isn’t nearly as dramatic as we tend to think. We’re ultimately playing to win our fantasy leagues, not just field a competitive roster. The way to win is by staying left of the cliff. Luckily, the linebacker position pushes that cliff further right than the defensive line, buying us time to draft appropriately.
The Leverage Curve
Lastly, one more influx of key data to hammer home the importance of staying ahead of the cliff: a new metric that I’m going to refer to as “The Leverage Curve.” This data essentially quantifies the actual fantasy points lost by each rank if we’re not drafting the best player at the position. This should help visualize just how much value we’re passing up on with each elite IDP that comes off the board. Whether you’re passing up on defensive line knowingly, or doing it involuntarily as you get used to drafting IDPs, it’s worth noting just how much value we’re losing by not making those high-end DL bets.
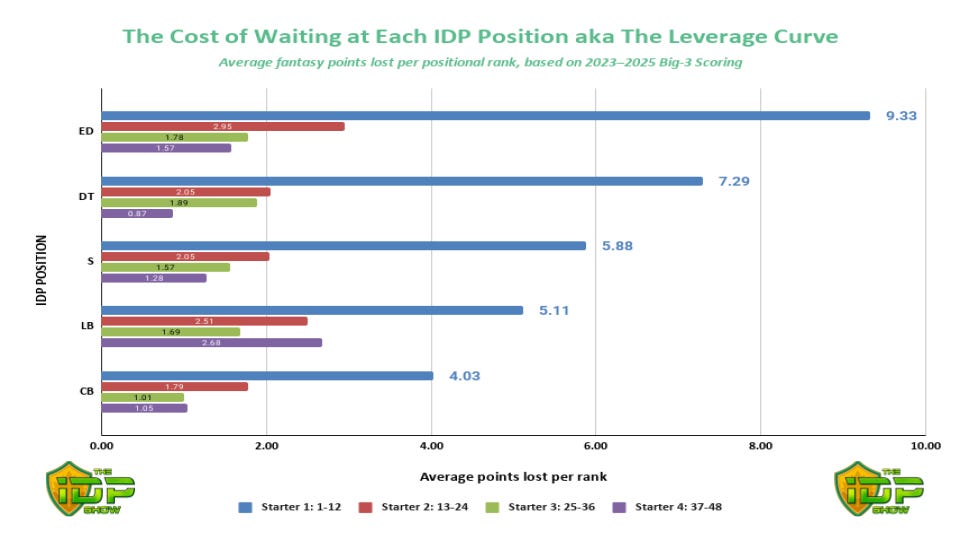
Once again, the EDGE position presents an enormous difference in the elite performers at the top. This chart illustrates the cost of not hitting on the overall top scorer at the position, showing the average over the past three seasons; with each passing rank, we’re 9.33 fantasy points in value within those top-12 EDGEs. That is significantly more damaging than at defensive tackle, which is the next closest, and close to double that of linebacker at 5.11 points per rank.
This means that dropping several spots within the first tier of EDGEs has historically created high cost. For example:
Five EDGE ranks at a 9.33 rate equates to nearly 47 points of expected season-long production.
That same five-rank slide among the Tier 1 linebackers costs just over 25 points.
That cost at linebacker is much more in line with cornerbacks than it is defensive linemen, where you’d only be losing around 20 total CB points with that same five-rank slide.
Once again, we need to be betting on the league-winning potential of the top-performing EDGEs, as hitting on a top-five player at the position will give you the biggest advantage over the rest of your league — more so than the other IDP positions. Don’t be shy about betting on the Tier 1 EDGEs, because we need to increase our odds of hitting. Even if you land the 10th best player at the position, it might not be good enough, as that’s 94.6 points in value lost because we ended up on the wrong side of the curve. At linebacker, that penalty isn’t nearly as dramatic, as we’d only be losing 50 points in value at LB10 versus LB1 over the replacement player. This often means you need to take multiple swings at EDGE before drafting a linebacker, and you shouldn’t be afraid to do so.
As highlighted in the chart below, the EDGE position carries a dramatic Tier Wait Cost at nearly double that of the linebacker position.
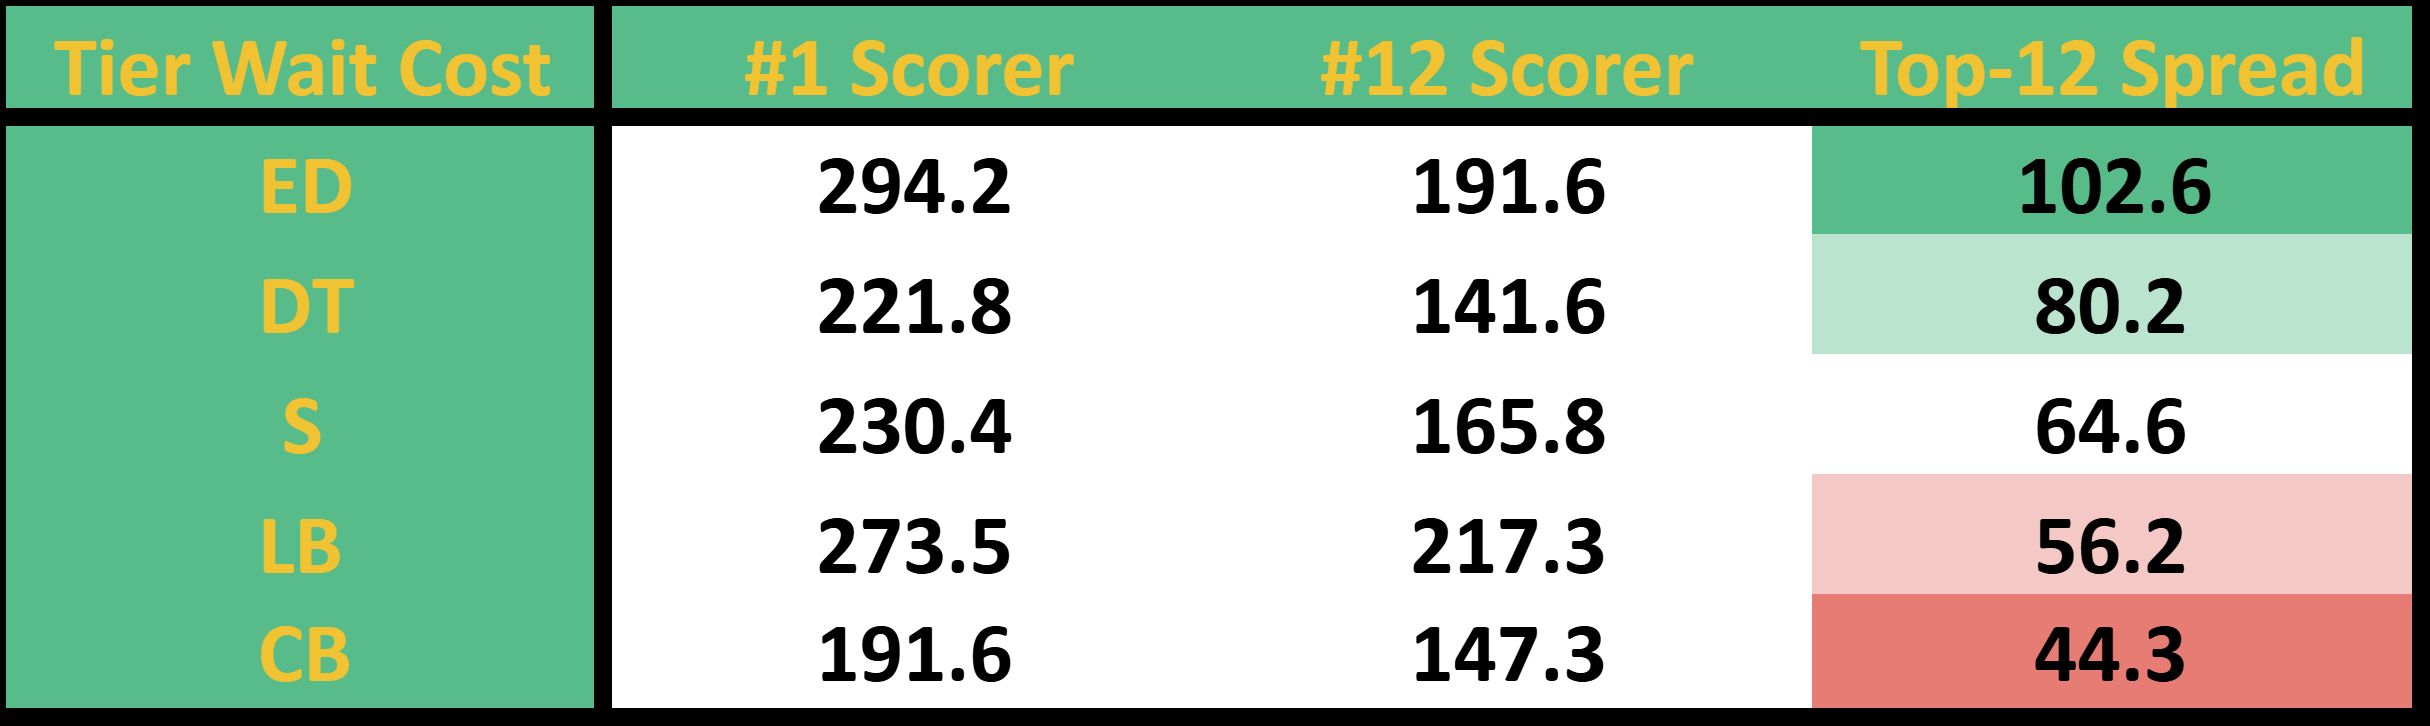
The curve at linebacker is much more forgiving, which gives us an opportunity to place those bets at ED1 earlier and wait on the linebacker position without being harshly punished. The same goes for the defensive back positions, especially, with variance and a flatter curve helping buy us time in our drafts as we target greater values.
Conclusion
Securing an elite player at every position is obviously the goal, and hopefully with this data I provided a better understanding of how many opportunities we have to do so. This information wasn’t just about informing you which positions are scarce, but where within those positions the scarcity exists.
To simplify all of this information, just follow these three rules:
1. Target elite EDGEs (and DT, if applicable) early! Don’t leave it to the middle tiers.
Elite DLs hold league-winning upside as the annual top scorers in IDP, but the cliff is steep, and by the time you get outside that top tier, those league-winning advantages might already be gone.
2. Let linebacker and safety value fall to you.
While there’s still a curve among the top performers, the cliff isn’t nearly as steep and comes much later at these positions, so we can afford to wait.
3. Cornerbacks are for the final rounds.
The difference in scoring between the top-performing CBs and replacement-level players isn't nearly enough to justify spending up at the position. Especially when you factor in the variance in how Tier 1 production and performers change year to year.
Good luck in your drafts this year, but now, after reading this, you should have much more than luck on your side.
Stay tuned for Part 2 of this League-Winning IDP Draft Strategy series, where I’ll cover some of the key mistakes to avoid in your annual fantasy football drafts.
Be sure to subscribe to The IDP Show on Apple, Spotify, or YouTube.
You can follow us on all our social media channels, including Twitter and Instagram.